yingweiwo

Auxinole

Cat No.:V11910 Purity: ≥98%
Auxinole is a potent TIR1/AFB receptor phytohormone antagonist that can bind to TIR1 and prevent the formation of TIR1-IAA-Aux/IAA complex, thereby inhibiting the expression of auxin-responsive genes.
Auxinole
Auxinole Chemical Structure CAS No.: 86445-22-9
Product category: New1
This product is for research use only, not for human use. We do not sell to patients.
Size Price Stock Qty
5mg
10mg
50mg
100mg
Other Sizes
Official Supplier of:
Alternate Text
Alternate Text
Alternate Text
Alternate Text
Alternate Text
Alternate Text
Alternate Text
Alternate Text
Alternate Text
Alternate Text
Alternate Text
Alternate Text
Alternate Text
Alternate Text
Alternate Text
Alternate Text
Alternate Text
Alternate Text
Alternate Text
Alternate Text
Alternate Text
Alternate Text
Alternate Text
Alternate Text
Alternate Text
Alternate Text
Alternate Text
Alternate Text
Alternate Text
Alternate Text
Alternate Text
Alternate Text


  • Business Relationship with 5000+ Clients Globally
  • Major Universities, Research Institutions, Biotech & Pharma
  • Citations by Top Journals: Nature, Cell, Science, etc.
Top Publications Citing lnvivochem Products
Product Description
Auxinole is a potent TIR1/AFB receptor phytohormone antagonist that can bind to TIR1 and prevent the formation of TIR1-IAA-Aux/IAA complex, thereby inhibiting the expression of auxin-responsive genes.
Biological Activity I Assay Protocols (From Reference)
ln Vitro
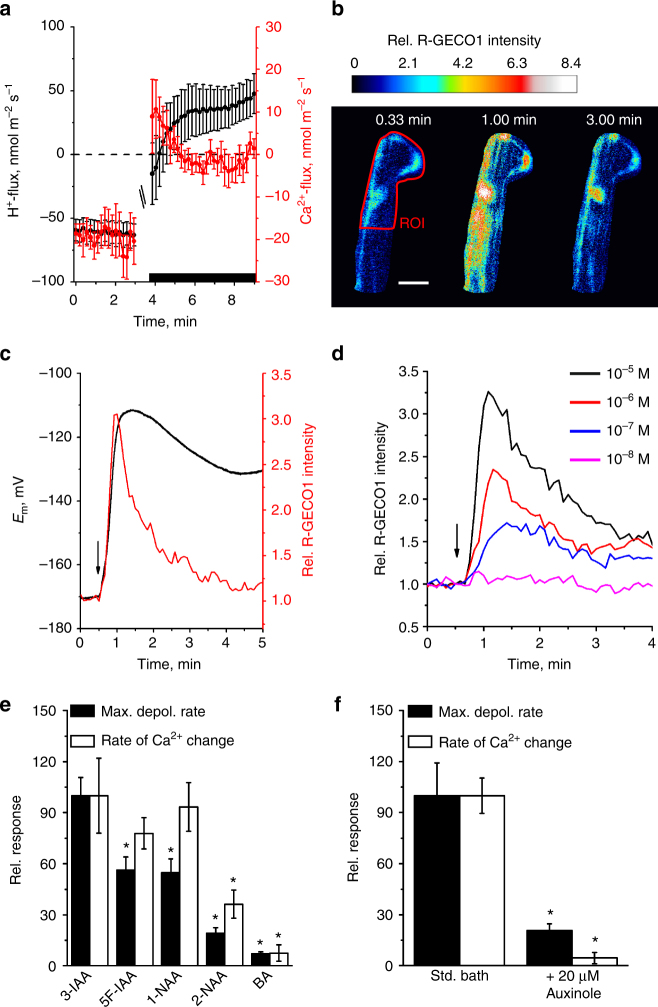
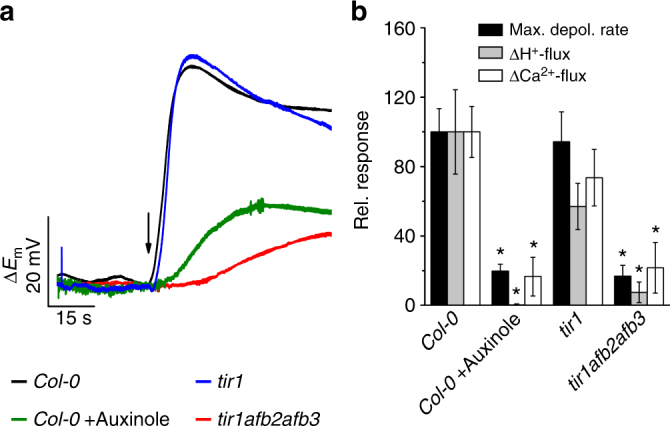
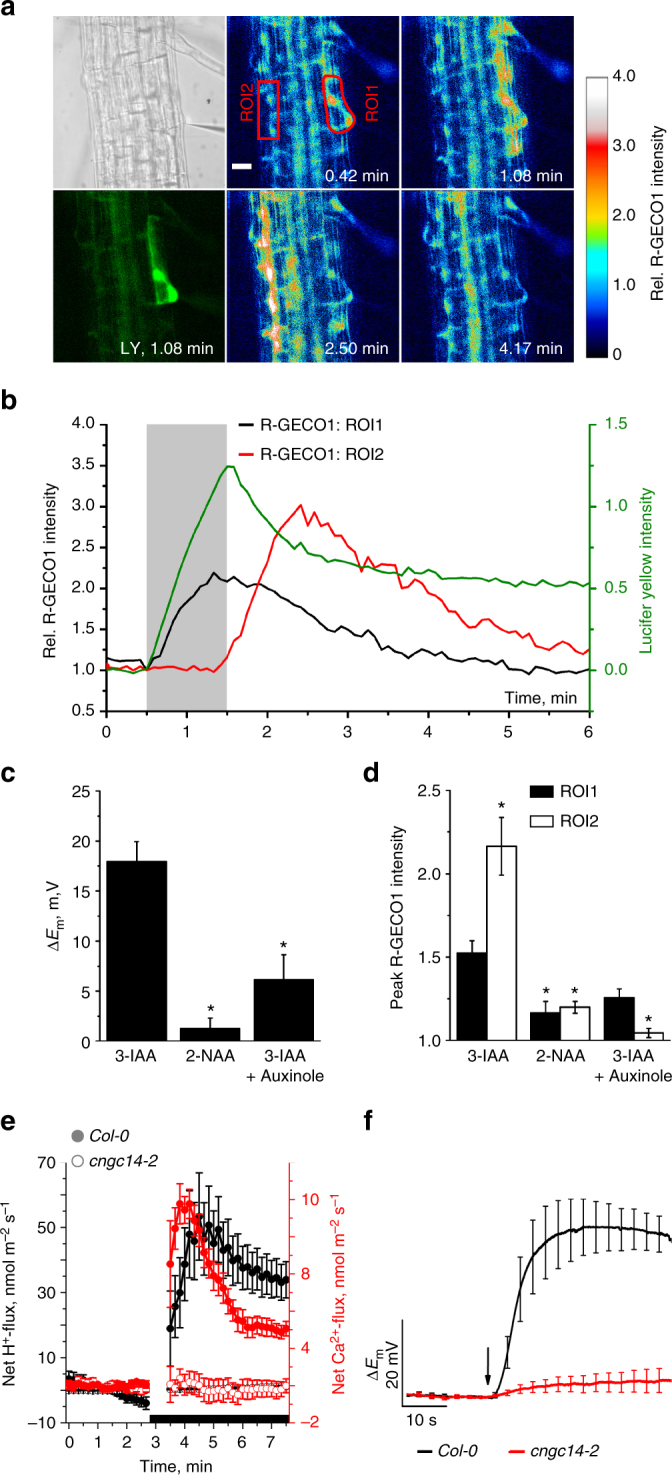
Strongly inhibiting the expression of auxin-responsive genes, auxinole binds to TIR1 to increase the TIR1-IAA-Aux/IAA complex. This is a powerful TIR1/AFB receptor auxin blocking antagonist. Furthermore, auxinole complementarily inhibits a variety of plant growth responses caused by hormones [1]. In root hair cells, auxinole significantly lowers the amount of IAA-triggered detoxification. The brief rise in [Ca2+]cyt is nevertheless entirely inhibited by auxinole (20 μM), which also fills the Ca2+ response[2].
References

[1]. Rational design of an auxin antagonist of the SCF(TIR1) auxin receptor complex. ACS Chem Biol. 2012 Mar 16;7(3):590-8.

[2]. AUX1-mediated root hair auxin influx governs SCFTIR1/AFB-type Ca2+ signaling. Nat Commun. 2018 Mar 21;9(1):1174.

These protocols are for reference only. InvivoChem does not independently validate these methods.
Physicochemical Properties
Molecular Formula
C20H19NO3
Molecular Weight
321.369765520096
Exact Mass
321.136
CAS #
86445-22-9
PubChem CID
13077496
Appearance
White to off-white solid powder
LogP
3.6
Hydrogen Bond Donor Count
2
Hydrogen Bond Acceptor Count
3
Rotatable Bond Count
5
Heavy Atom Count
24
Complexity
478
Defined Atom Stereocenter Count
0
SMILES
O=C(C(CC(C1C(C)=CC(C)=CC=1)=O)C1C2C(=CC=CC=2)NC=1)O
InChi Key
HGUYAIJBXSQXGV-UHFFFAOYSA-N
InChi Code
InChI=1S/C20H19NO3/c1-12-7-8-14(13(2)9-12)19(22)10-16(20(23)24)17-11-21-18-6-4-3-5-15(17)18/h3-9,11,16,21H,10H2,1-2H3,(H,23,24)
Chemical Name
4-(2,4-dimethylphenyl)-2-(1H-indol-3-yl)-4-oxobutanoic acid
HS Tariff Code
2934.99.9001
Storage

Powder      -20°C    3 years

                     4°C     2 years

In solvent   -80°C    6 months

                  -20°C    1 month

Shipping Condition
Room temperature (This product is stable at ambient temperature for a few days during ordinary shipping and time spent in Customs)
Solubility Data
Solubility (In Vitro)
DMSO : ≥ 125 mg/mL (~388.96 mM)
Ethanol : ~2.5 mg/mL (~7.78 mM)
Solubility (In Vivo)
Solubility in Formulation 1: ≥ 2.5 mg/mL (7.78 mM) (saturation unknown) in 5% DMSO + 40% PEG300 + 5% Tween80 + 50% Saline (add these co-solvents sequentially from left to right, and one by one), clear solution.
Preparation of saline: Dissolve 0.9 g of sodium chloride in 100 mL ddH₂ O to obtain a clear solution.

Solubility in Formulation 2: ≥ 2.5 mg/mL (7.78 mM) (saturation unknown) in 5% DMSO + 95% (20% SBE-β-CD in Saline) (add these co-solvents sequentially from left to right, and one by one), clear solution.
Preparation of 20% SBE-β-CD in Saline (4°C,1 week): Dissolve 2 g SBE-β-CD in 10 mL saline to obtain a clear solution.

View More

Solubility in Formulation 3: ≥ 2.08 mg/mL (6.47 mM) (saturation unknown) in 10% DMSO + 40% PEG300 + 5% Tween80 + 45% Saline (add these co-solvents sequentially from left to right, and one by one), clear solution.
For example, if 1 mL of working solution is to be prepared, you can add 100 μL of 20.8 mg/mL clear DMSO stock solution to 400 μL PEG300 and mix evenly; then add 50 μL Tween-80 to the above solution and mix evenly; then add 450 μL normal saline to adjust the volume to 1 mL.
Preparation of saline: Dissolve 0.9 g of sodium chloride in 100 mL ddH₂ O to obtain a clear solution.


Solubility in Formulation 4: ≥ 2.08 mg/mL (6.47 mM) (saturation unknown) in 10% DMSO + 90% (20% SBE-β-CD in Saline) (add these co-solvents sequentially from left to right, and one by one), clear solution.
For example, if 1 mL of working solution is to be prepared, you can add 100 μL of 20.8 mg/mL clear DMSO stock solution to 900 μL of 20% SBE-β-CD physiological saline solution and mix evenly.
Preparation of 20% SBE-β-CD in Saline (4°C,1 week): Dissolve 2 g SBE-β-CD in 10 mL saline to obtain a clear solution.

Solubility in Formulation 5: ≥ 2.08 mg/mL (6.47 mM) (saturation unknown) in 10% DMSO + 90% Corn Oil (add these co-solvents sequentially from left to right, and one by one), clear solution.
For example, if 1 mL of working solution is to be prepared, you can add 100 μL of 20.8 mg/mL clear DMSO stock solution to 900 μL of corn oil and mix evenly.

 (Please use freshly prepared in vivo formulations for optimal results.)
Preparing Stock Solutions 1 mg 5 mg 10 mg
1 mM 3.1117 mL 15.5584 mL 31.1168 mL
5 mM 0.6223 mL 3.1117 mL 6.2234 mL
10 mM 0.3112 mL 1.5558 mL 3.1117 mL

*Note: Please select an appropriate solvent for the preparation of stock solution based on your experiment needs. For most products, DMSO can be used for preparing stock solutions (e.g. 5 mM, 10 mM, or 20 mM concentration); some products with high aqueous solubility may be dissolved in water directly. Solubility information is available at the above Solubility Data section. Once the stock solution is prepared, aliquot it to routine usage volumes and store at -20°C or -80°C. Avoid repeated freeze and thaw cycles.

Calculator

Molarity Calculator allows you to calculate the mass, volume, and/or concentration required for a solution, as detailed below:

  • Calculate the Mass of a compound required to prepare a solution of known volume and concentration
  • Calculate the Volume of solution required to dissolve a compound of known mass to a desired concentration
  • Calculate the Concentration of a solution resulting from a known mass of compound in a specific volume
An example of molarity calculation using the molarity calculator is shown below:
What is the mass of compound required to make a 10 mM stock solution in 5 ml of DMSO given that the molecular weight of the compound is 350.26 g/mol?
  • Enter 350.26 in the Molecular Weight (MW) box
  • Enter 10 in the Concentration box and choose the correct unit (mM)
  • Enter 5 in the Volume box and choose the correct unit (mL)
  • Click the “Calculate” button
  • The answer of 17.513 mg appears in the Mass box. In a similar way, you may calculate the volume and concentration.

Dilution Calculator allows you to calculate how to dilute a stock solution of known concentrations. For example, you may Enter C1, C2 & V2 to calculate V1, as detailed below:

What volume of a given 10 mM stock solution is required to make 25 ml of a 25 μM solution?
Using the equation C1V1 = C2V2, where C1=10 mM, C2=25 μM, V2=25 ml and V1 is the unknown:
  • Enter 10 into the Concentration (Start) box and choose the correct unit (mM)
  • Enter 25 into the Concentration (End) box and select the correct unit (mM)
  • Enter 25 into the Volume (End) box and choose the correct unit (mL)
  • Click the “Calculate” button
  • The answer of 62.5 μL (0.1 ml) appears in the Volume (Start) box
g/mol

Molecular Weight Calculator allows you to calculate the molar mass and elemental composition of a compound, as detailed below:

Note: Chemical formula is case sensitive: C12H18N3O4  c12h18n3o4
Instructions to calculate molar mass (molecular weight) of a chemical compound:
  • To calculate molar mass of a chemical compound, please enter the chemical/molecular formula and click the “Calculate’ button.
Definitions of molecular mass, molecular weight, molar mass and molar weight:
  • Molecular mass (or molecular weight) is the mass of one molecule of a substance and is expressed in the unified atomic mass units (u). (1 u is equal to 1/12 the mass of one atom of carbon-12)
  • Molar mass (molar weight) is the mass of one mole of a substance and is expressed in g/mol.
/

Reconstitution Calculator allows you to calculate the volume of solvent required to reconstitute your vial.

  • Enter the mass of the reagent and the desired reconstitution concentration as well as the correct units
  • Click the “Calculate” button
  • The answer appears in the Volume (to add to vial) box
In vivo Formulation Calculator (Clear solution)
Step 1: Enter information below (Recommended: An additional animal to make allowance for loss during the experiment)
Step 2: Enter in vivo formulation (This is only a calculator, not the exact formulation for a specific product. Please contact us first if there is no in vivo formulation in the solubility section.)
+
+
+

Calculation results

Working concentration mg/mL;

Method for preparing DMSO stock solution mg drug pre-dissolved in μL DMSO (stock solution concentration mg/mL). Please contact us first if the concentration exceeds the DMSO solubility of the batch of drug.

Method for preparing in vivo formulation:Take μL DMSO stock solution, next add μL PEG300, mix and clarify, next addμL Tween 80, mix and clarify, next add μL ddH2O,mix and clarify.

(1) Please be sure that the solution is clear before the addition of next solvent. Dissolution methods like vortex, ultrasound or warming and heat may be used to aid dissolving.
             (2) Be sure to add the solvent(s) in order.

Biological Data
  • Auxin induces Ca2+-influx and increase of the cytosolic-free Ca2+-concentration of root-hair cells. a Average ion flux kinetics determined with ion-selective electrodes (H+ black symbols, left axis; Ca2+ red symbols, right axis, n = 12 ± s.e.m.). After 3 min, IAA was applied to a final concentration of 10 µM (black bar, curves are interrupted at time point of application). b IAA-evoked changes of the cytosolic-free Ca2+-concentration in root-hair cells, determined with R-GECO1. Images of a single root-hair cell, before, during, and after the application of 10 µM IAA. IAA was applied at t = 0.5 min. False colored images indicate R-GECO1 fluorescence intensity, relative to the average value in ROI (red line) just before IAA application (color code above the panels). The scale bar represents 20 µm. c Simultaneous measurement of IAA-induced depolarization (black trace, left axes) and change in R-GECO1 fluorescence intensity (red trace, right axes) of a ROI that includes the nucleus, in a single root-hair cell (arrow: time point of 1 s application of 10 µM IAA). Representative measurement from 26 experiments. d IAA-dependent changes in R-GECO1 fluorescence intensity determined across the root and representative of 7 experiments for each IAA concentration (indicated by colored lines). e Max. depolarization rate (closed bars) and slope of R-GECO1 intensity change (open bars) of single root-hair cells to 1 s pulses of 10 µM IAA and auxin analogs, as indicated. Data are given as percentage of the response to 3-IAA (n = 8 ± s.e.m. for BA and n = 16 ± s.e.m. for auxins), asterisks indicate significant reductions (Students t-test, p < 0.05). f Max. depolarization rate (closed bars) and slope of R-GECO1 intensity change (open bars) of single root-hair cells to a 1 s pulses of 10 µM IAA. Root-hair cells were measured under control conditions, or after 20 min pretreatment with 20 µM auxinole. Bars represent percentage of control (n = 10 ± s.e.m. for control and 11 ± s.e.m. for auxinole), asterisks indicate significant reductions (Students t-test, p < 0.05).[1].AUX1-mediated root hair auxin influx governs SCFTIR1/AFB-type Ca2+ signaling. Nat Commun. 2018 Mar 21;9(1):1174.
  • The auxin-induced plasma membrane depolarization as well as H+- and Ca2+-influx are dependent on intracellular auxin perception. a IAA-dependent changes in the membrane potential of wild-type and receptor mutant root hairs. Representative traces of A. thaliana Col-0 in the presence (green) and absence (black) of 20 µM auxinole as well as of the tir1-1 (blue) and tir1-1afb2-3afb3-4 (red) mutants following a 1 s stimulation with 10 µM IAA (arrow). b Maximal depolarization rate (black bars) and initial change of H+- (gray bars) and Ca2+-flux (open bars), evoked by 10 µM IAA in roots of Col-0 (n = 14 ± s.e.m. for depolarization; n = 10 ± s.e.m. for ion fluxes), Col-0 pretreated with 20 µM auxinole (n = 6 ± s.e.m. for depolarization; n = 4 ± s.e.m. for ion fluxes), as well as in tir1-1 (n = 8 ± s.e.m. for depolarization; n = 16 ± s.e.m. for ion fluxes) and in tir1-1afb2-3afb3-4 (n = 6 ± s.e.m. for depolarization; n = 9 ± s.e.m. for ion fluxes). Values are given as the percentage of the wild-type response. Asterisks indicate significant reductions (Students t-test, p < 0.05).[1].AUX1-mediated root hair auxin influx governs SCFTIR1/AFB-type Ca2+ signaling. Nat Commun. 2018 Mar 21;9(1):1174.
  • Cytosolic application of IAA triggers a lateral Ca2+ wave in roots. a IAA was applied iontophoretically together with Lucifer yellow (LY) via an intracellular double-barreled microelectrode. Panel upper left, transmitted light signal, note microelectrode on right. Panel lower left, LY fluorescence signal at indicated time value. Panels middle and right, false color images of R-GECO1 intensity, normalized to the average value of ROI1 just before stimulation with IAA, as indicated by the scale on left. Time after experiment onset is given. IAA was injected with a current of -1 nA to the cell in ROI1, from t = 0.5 to 1.5 min. Representative measurement from 20 experiments. The scale bar represents 20 µm. b Representative time-dependent changes in the fluorescence signal of LY (green line, right axis) and the R-GECO1 signals of ROI1 (black line, left axis) and ROI2 (red line, left axis), relative to their average fluorescence intensity at the start of injection. The light gray bar indicates the period of iontophoretic injection of IAA. Representative measurement from 20 experiments. c, d Responses of A. thaliana Col-0 root-hair cells to iontophoretical intracellular injection of IAA, 2-NAA, and IAA in roots pretreated with 20 µM auxinole. c Average value of max. depolarization. d Average changes in R-GECO1 signals of ROI1 (closed bars) and ROI2 (open bars, n = 20 ± s.e.m. for IAA; n = 11 ± s.e.m. for 2-NAA and n = 6 ± s.e.m. for IAA w/auxinole), asterisks indicate significant differences (Students t-test, p < 0.05). e Average net Ca2+- (red) and H+- (black) flux kinetics of wild-type (closed symbols) and cngc14-2 (open symbols) roots. After 3 min, IAA was applied to a final concentration of 10 µM (black bar), curves are interrupted at time point of IAA stimulation, n = 17 ± s.e.m. for Col-0 Ca2+-fluxes, n = 18 ± s.e.m. for cngc14-2 Ca2+-fluxes, n = 7 ± s.e.m. for H+-fluxes. f IAA-dependent changes in the membrane potential of wild-type and cngc14-2 mutant root hairs. Average traces of A. thaliana Col-0 (black) and of the cngc14-2 (red) mutant following a 1 s stimulation with 10 µM IAA (arrow) (n = 6 ± s.e.m. for Col-0 and n = 7 ± s.e.m. for cngc14-2).[1].AUX1-mediated root hair auxin influx governs SCFTIR1/AFB-type Ca2+ signaling. Nat Commun. 2018 Mar 21;9(1):1174.
Contact Us